

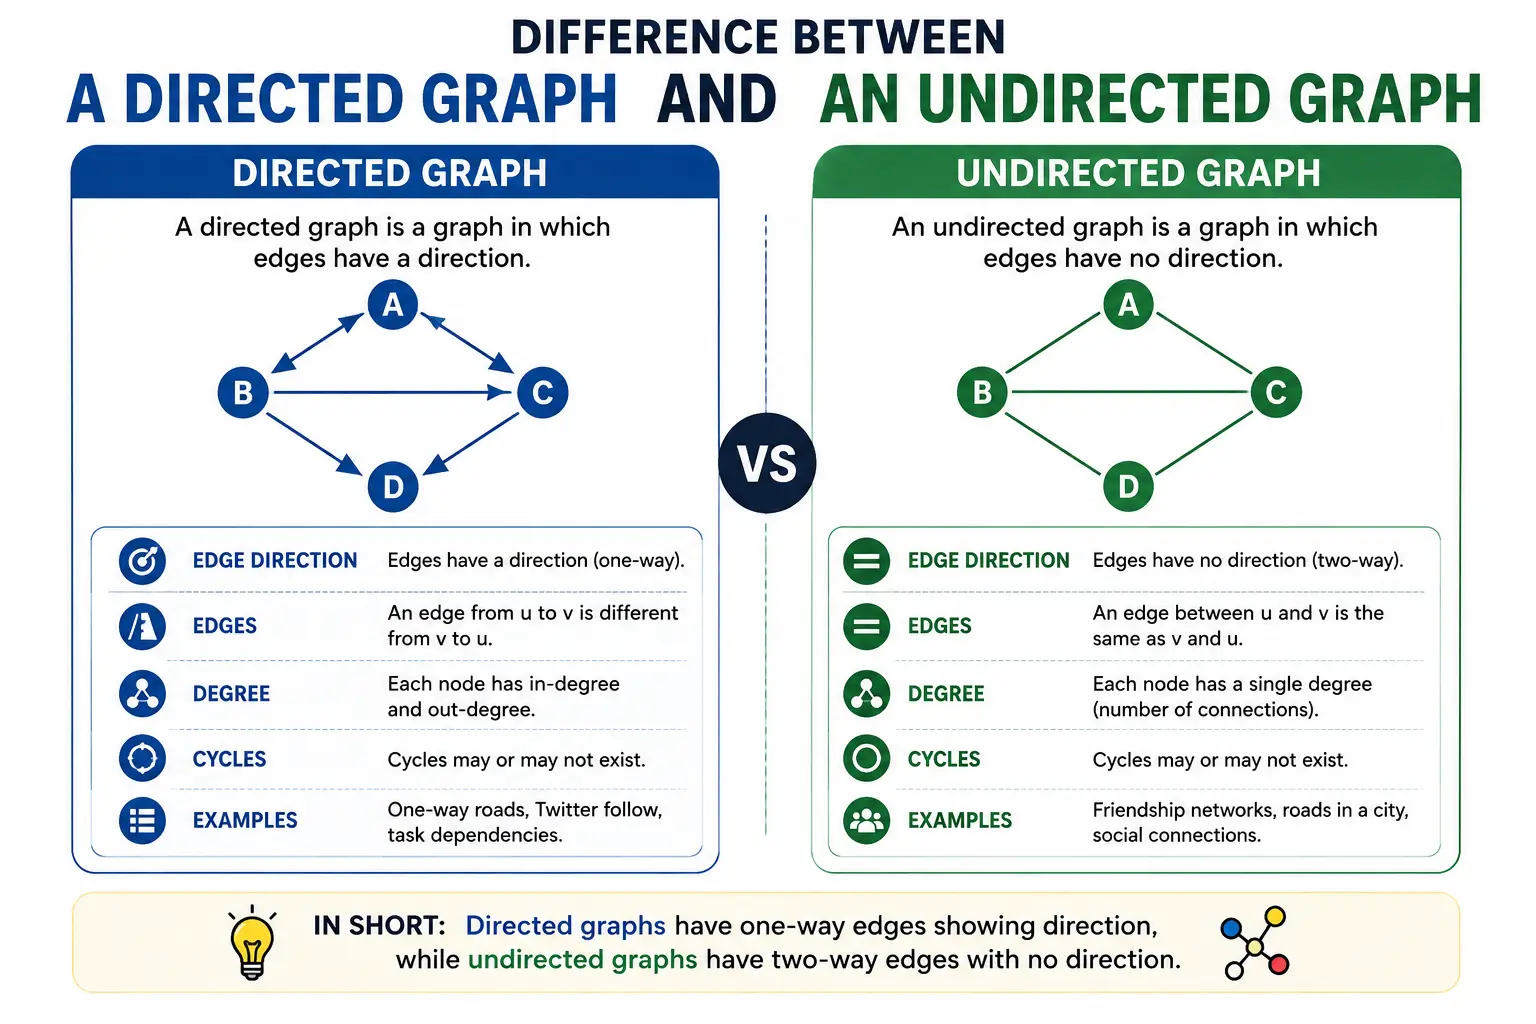
In the fields of technology and computer science, it’s common to encounter the need to represent data in various ways. One of the most widely used methods for this representation is the use of graphs. However, within this concept, there are different types of graphs that adapt to diverse needs and contexts. Two of the most important types are directed graphs and undirected graphs. Although they may seem similar, they have very different characteristics and applications. Below, we will explore the differences between them in detail.
Definition of Directed Graphics
A directed graph is a structure consisting of a set of nodes or vertices, where each pair of nodes is connected by an edge or boundary that has a specific direction. This means that the connections between the nodes have a direction, allowing for the establishment of a flow or order in the relationship between them. For example, in a graph representing the relationships between people in a social network, a directed edge might indicate that one person follows another, but not necessarily vice versa. This direction in the connections is fundamental to understanding the behavior of the system being modeled.
Directed graphs are used in various applications, such as social network analysis, where understanding who follows whom is crucial, or in representing paths in navigation systems. These graphs allow for the identification of specific routes and the determination of information or resource flows. The direction of the edges enables the establishment of hierarchies and control flows, which is essential in fields like computer science and engineering.
Definition of Undirected Graphics
On the other hand, an undirected graph is a similar structure, but in this case, the connections between nodes do not have a specific direction. This means that if an edge exists between two nodes, both nodes are symmetrically related. A classic example of an undirected graph is a friendship network, where if A is friends with B, then B is also friends with A. This symmetry feature is fundamental to understanding the interactions in this type of graph.
Undirected graphs are useful in various fields, such as graph theory and network analysis. For example, they can be used to model the connections between computers on a local network, where communication can flow in both directions. They are also applied in biology to represent interactions between species in an ecosystem, where relationships are reciprocal. The lack of direction allows for a broader understanding of how elements are interconnected within a system.
Key Differences Between Targeted and Untargeted Charts
The differences between directed and undirected graphs are fundamental and can be summarized in several key aspects. First, as mentioned, the main difference lies in the direction of the edges. In directed graphs, each connection has a specific direction, while in undirected graphs, the connections are bidirectional. This difference affects how the data and the relationships between nodes are interpreted.
- Edge direction: In directed graphs, edges have direction; in undirected graphs, they do not.
- Symmetry: Relationships in undirected graphs are symmetrical, while in directed graphs they can be asymmetrical.
- Applications: Directed graphs are common in social networks and navigation systems; undirected graphs are used in network analysis and biology.
Another important difference is the type of algorithms used to analyze these graphs. Algorithms designed for directed graphs, such as Dijkstra’s algorithm for finding the shortest path, take into account the direction of the edges. In contrast, algorithms for undirected graphs can use different methods, such as depth-first or breadth-first search, which do not require considering direction. This means that the approaches to solving problems in these two types of graphs can be quite different.
Examples of Directed Charts
To better illustrate the concept of directed graphics, let’s consider some examples. One of the most common examples is a flowchart, which is used to represent processes in programming or decision-making. In a flowchart, each step of the process is connected by arrows that indicate the direction of the flow of control. This allows programmers and analysts to understand how information moves through the system.
Another example of a directed graph is that of web pages and their links. Each web page can be seen as a node, and each link between pages can be considered a directed edge. This means that if page A links to page B, the relationship is unidirectional. Search engines use this type of graph to determine the relevance of web pages by analyzing how they connect to each other and the traffic they generate.
Examples of Undirected Charts
In the case of undirected graphs, a classic example is the road network between cities. In this model, each city is a node and each road is an edge. The connections are bidirectional, meaning that you can travel from one city to another in both directions. This type of representation is useful for analyzing routes and determining the best way to travel between different points.
Another example of an undirected graph is found in social networks, where friendship connections are bidirectional. If user A is friends with user B, then B is also friends with A. This type of relationship allows analysts to study social dynamics, communities, and how information spreads within the network.
Practical Applications of Directed Graphics
Directed graphs have numerous practical applications in today’s world. In the field of computer science, they are used for algorithm analysis and process optimization. For example, in route planning for transportation networks, directed graphs help identify the most efficient route by considering the direction of connections. This is crucial for logistics and distribution systems, where time and efficiency are critical.
Furthermore, in the field of artificial intelligence, directed graphs are used to model decisions and strategies. For example, in recommendation systems, where user decisions can be represented in a directed graph, preferences and behaviors can be analyzed to offer personalized recommendations. This is common in streaming platforms and e-commerce, where understanding user decisions is essential for improving the user experience.
Practical Applications of Undirected Graphics
Undirected graphs also have significant practical applications. In the field of biology, they are used to model interactions between species in an ecosystem. For example, if two species are mutually dependent, their relationship can be represented as an edge in an undirected graph. This allows biologists to study the stability of ecosystems and how disturbances can affect the species involved.
Furthermore, in the field of telecommunications networks, undirected graphs are useful for representing the connections between different devices. In this context, each device is a node, and the connections are edges that enable communication. This representation helps engineers analyze network efficiency and identify potential points of failure or congestion.
Advantages and Disadvantages of Directed Graphics
Like any tool, directed graphs have their advantages and disadvantages. Among the advantages, their ability to represent asymmetric relationships stands out. This is especially useful in situations where the direction of the relationship is crucial, such as in social network analysis or navigation systems. Furthermore, they allow for a more detailed analysis of information and resource flows, which can be beneficial in process optimization.
However, one disadvantage of directed graphs is that they can be more complex to analyze. The direction of the edges introduces an additional layer of complexity, which can make some algorithms more difficult to implement. Furthermore, if one is not careful, it is easy to overlook bidirectional relationships that may be important in certain contexts.
Advantages and Disadvantages of Undirected Graphics
As for undirected graphs, their advantages include the simplicity of representing symmetric relationships. This makes them easy to understand and analyze, which can be beneficial in situations where relationships are inherently mutual. Furthermore, the algorithms used to analyze undirected graphs tend to be simpler, facilitating their implementation in various contexts.
However, a disadvantage of undirected graphs is that they cannot represent asymmetric relationships. This can be a limitation in situations where the direction of the relationship is important. Furthermore, the lack of direction can lead to misinterpretations of the data, especially in contexts where the flow of information or resources is crucial for the analysis.
Comparison of Algorithms for Directed and Undirected Graphs
Comparing algorithms for directed and undirected graphs reveals significant differences in their design and application. In directed graphs, algorithms like Dijkstra’s are widely used to find shorter paths, as they take into account the direction of edges. This algorithm is essential in navigation and route optimization applications, where the flow of information must follow a specific direction.
In contrast, undirected graphs typically use algorithms such as depth-first search (DFS) and breadth-first search (BFS). These algorithms do not require considering the direction of edges, making them simpler and more straightforward. They are especially useful in situations where the goal is to explore all nodes in a graph, such as in social network analysis or identifying connected components in a system.
Future of Directed and Undirected Graphics
The future of directed and undirected graphs is promising, as both types continue to evolve and adapt to new technologies and needs. In the field of artificial intelligence and machine learning, directed graphs are expected to play a crucial role in modeling complex decisions and strategies. As systems become more sophisticated, the ability to represent asymmetric relationships will become increasingly important.
On the other hand, undirected graphs will remain relevant in areas such as biology and network analysis. As technologies advance, the need to understand the mutual interactions between elements becomes increasingly crucial. Representing these relationships clearly and effectively will be essential for progress in various fields of research and application.
Summary of Differences
In summary, the difference between directed and undirected graphs lies primarily in the direction of the edges and the nature of the relationships they represent. Directed graphs are ideal for modeling asymmetric relationships, while undirected graphs are better suited for symmetric relationships. Both types of graphs have their advantages and disadvantages, as well as specific applications that make them valuable in different contexts. With the continuous advancement of technology, the understanding and use of these graphs are likely to continue evolving, adapting to the changing needs of society and science.
